
Another Facebook change???
It’s not everyday Facebook makes a functionality change…just kidding. It pretty much happens every day (or so feels like it). And while most of these updates seem to leave social media managers scrambling to figure out a new algorithm or feature, this latest change might be one we can celebrate.
The platform seems to be tinkering with Facebook Page Insight exports. While all the categories of data we’re familiar with are still available—Page data, Post data, and Video data—Facebook has reworked those exports’ layouts.
I prefer to do our analytics by hand and rely on a series of Excel Templates to help streamline and expedite the process, something I got to master and practice when I earned my professional certificate in Social Media Measurement for Higher Ed. When I saw the layouts of the exports had changed, I was far from thrilled. I was convinced that not only were my templates now useless but that all of my historical reports would need to updated.
New Facebook data export layouts: a positive and progressive change
Thankfully, Facebook foresaw the absolute madness it could have caused and unveiled new layout options while keeping the old layouts available (including the original layout that has the viral and PTAT information).
The most exciting change is the ability to create, export AND save a custom report so you can pull it again later without rebuilding it. This will allow to pull only the data you need.
Here’s a quick look at what options you have for a custom layout for a Paga data export.
I’ve found it to be extremely similar to the reports you can build for your Facebook Ads.
While I haven’t gone through every single option to confirm this, it does look like there are more data points available in these new custom reports than Facebook had been providing us up until now.

So, how does it work?
As you select what data you want in your custom report, it populates the column on the right (where it currently says 0 COLUMNS SELECTED).
One important caveat to note: some of these data points cannot live in the same sheet due to how the information is presented.
This doesn’t mean you can’t include these items in your custom report. It just means you need to use the Add a Sheet Separator feature (located in the bottom right hand corner of the image) to separate them. You can see a quick walk through of what that looks like in the quick video below.
What’s different?
The report does a really nice job of letting you know what exactly you’re adding and what you need to tweak to successfully pull your data.
It prompts you to make the necessary changes and is descriptive, so you don’t have to guess what needs to be adjusted. It also provides definitions of each option, including whether the data will be for unique or total users.
This is extremely helpful since this update seem to be rolling out slowly and no official documentation from Facebook has been published.
While there is a custom report option for the Page data, I haven’t found any additional layout changes. It’s still the current default download. It’s just called the “Legacy Layout” now.
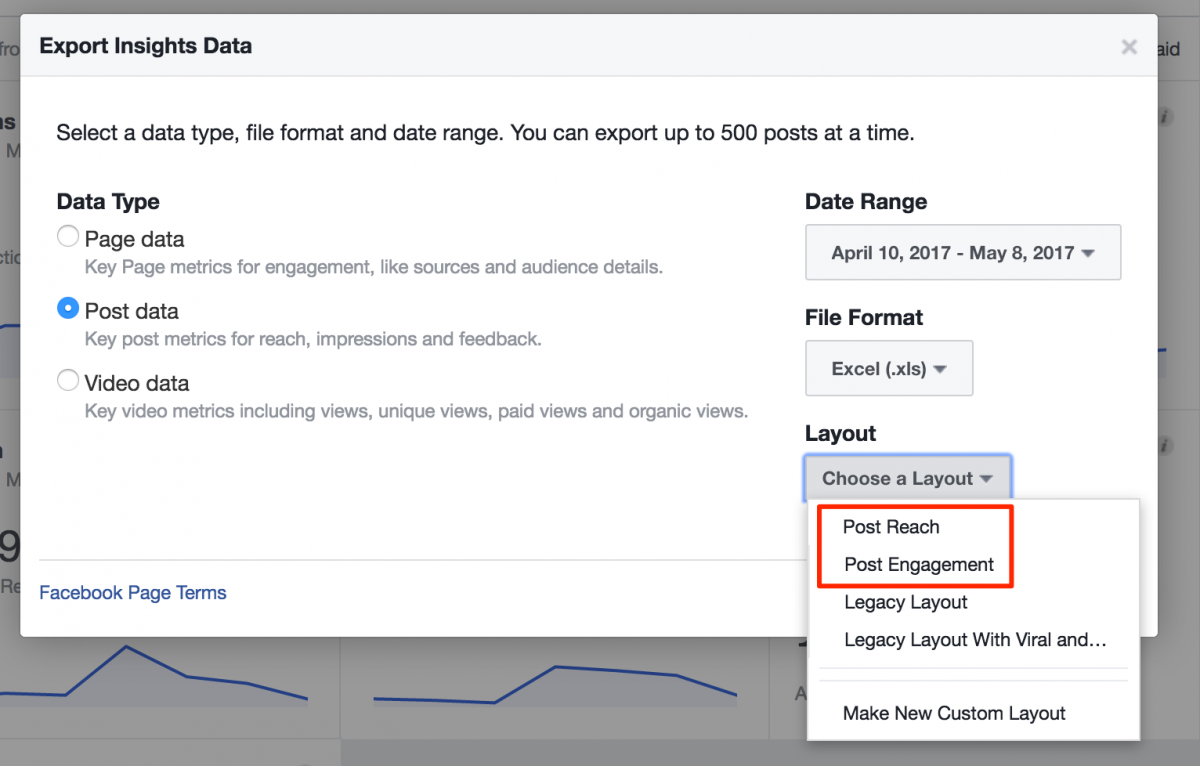
We see the most layout changes with the Post data export with the addition of two new layout options: Post Reach and Post Engagement. Like the Page data export, the older formats are still available to download.
These layouts drastically reduce the amount of tabs and data in each report. Instead of a couple dozen tabs, each export only has two sheets within a download.
Much easier to navigate.
More focused – and narrow? – data reports
The reports, in my opinion, have tried to isolate some of the “VIP data points.”
For instance, the Post Reach report focuses in on the amount of users reached and actions they took on posts (link clicks, photo views, and other clicks). Check out an example report I downloaded (Google Sheet). While the Post Engagement export looks at post consumption and the negative feedback on posts. Here’s an example of this report.
Now, don’t get me wrong—I love the simplicity of these reports. I actually pair down my own Posts data export to five tabs. But, these two reports simplify and condense things a little too much for my taste. They leave a lot of questions unanswered. Not to mention that while the Post Reach report does have columns for video data, none of my video posts are listed in the export.
I’m not sure if this is a bug or there are more updates are coming. It just seems odd to me to have columns for the data but no information. But, don’t worry! These numbers are still available in the legacy downloads and in the Video data, which appears to be the only unchanged export and the only set of data that doesn’t have its own customizable report either.
It seems like Facebook is slowly giving us more control over the data from our pages which is a huge win in my book.
I’d love to see them enable a way to schedule these reports, similar to their ads, so at the end of every month I could have all the information I need sitting right in my inbox. Baby steps first, I guess!
What do you think? Do you like these changes? Leave your thoughts below in the comments!
Meet the Author: Erin Supinka
Erin Supinka is the Assistant Director of Digital Engagement at Dartmouth College. She is also a graduate of Higher Ed Experts’ professional certificate program in Social Media Measurement for Higher Ed
Tags: Higher Ed Marketing Memos, Higher Ed News
This is good, thanks. My model has always been a full export, then I take the data I want and place it in a Google sheet with Twitter, LinkedIn and YouTube data. All this is in a folder called April 2017. From there, I do one Google doc highlighting the 6 most relevant pieces of data per platform along with % change over previous month.
This will help in noticing anomalies. Why did you get so many impressions? Reach? Who were the people? Right now, I need to dig through the 26 tabs and assemble the data. Now I can expect it.
Decent.